$q.capacitor
While you are developing a Mobile App with Capacitor Mode, you can access $q.capacitor in your Vue files. This is an alias to the global Capacitor Object.
Android Tips
Android remote debugging
If you are debugging Android Apps, you can use Google Chrome Remote Debugging through a USB cable attached to your Android phone/tablet. It can be used for emulator too.
This way you have Chrome Dev Tools directly for your App running on the emulator/phone/table. Inspect elements, check console output, and so on and so forth.


Accept Licenses
If you are having problems getting Android builds to finish and you see a message like:
> Failed to install the following Android SDK packages as some licenses have not been accepted.If this is the case you need to accept ALL the licenses. Thankfully there is a tool for this:
- Linux:
sdkmanager --licenses - macOS:
~/Library/Android/sdk/tools/bin/sdkmanager --licenses - Windows:
%ANDROID_SDK_ROOT%/tools/bin/sdkmanager --licenses
Android SDK not found after installation of the SDK
WARNING
The environmental variable ANDROID_HOME has been deprecated and replaced with ANDROID_SDK_ROOT. Depending on your version of Android Studio you may need one or the other. It doesn’t hurt to have both set.
Some newer Debian-based OS (e.g. ubuntu, elementary OS) might leave you with a Android SDK not found. after you installed and (correctly) configured the environment.
This could have two different reasons: Usually the paths aren’t configured correctly. The first step is to verify if your paths are set correctly. This can be done by running the following commands:
echo $ANDROID_HOME
# or
echo $ANDROID_SDK_ROOT
The expected output should be a path similar to this $HOME/Android/Sdk. After this run:
ls -la $ANDROID_HOME
# or
ls -la $ANDROID_SDK_ROOT
To ensure the folder contains the SDK. The expected output should contain folders like ‘tools’, ‘sources’, ‘platform-tools’, etc.
echo $PATHThe output should contain each one entry for the Android SDK ‘tools’-folder and ‘platform-tools’-tools. This could look like this:
/home/your_user/bin:/home/your_user/.local/bin:/usr/local/sbin:/usr/local/bin:/usr/sbin:/usr/bin:/sbin:/bin:/usr/games:/usr/local/games:/home/your_user/Android/Sdk/tools:/home/your_user/Android/Sdk/platform-toolsIf you ensured your paths are set correctly and still get the error, you can try the following fix: Replacing the Android Studio ‘tools’ folder manually
Android Studio
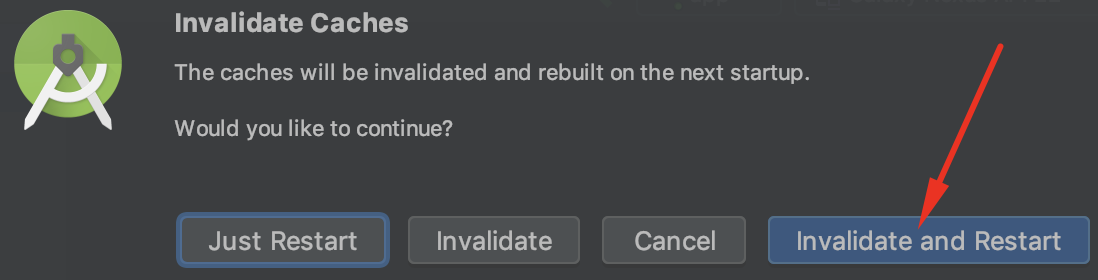
In Android Studio (if you open it on /src-capacitor/android), you will be greeted with a message recommending to upgrade the Gradle version. DO NOT UPGRADE GRADLE as it will break the Capacitor project. Same goes for any other requested upgrades.

If you encounter any IDE errors then click on File > Invalidate caches and restart.
Setting up device on Linux
You may bump into ?????? no permissions problem when trying to run your App directly on an Android phone/tablet.
Here’s how you fix this:
# create the .rules file and insert the content
# from below this example
sudo vim /etc/udev/rules.d/51-android.rules
sudo chmod 644   /etc/udev/rules.d/51-android.rules
sudo chown root. /etc/udev/rules.d/51-android.rules
sudo service udev restart
sudo killall adb
The content for 51-android.rules:
SUBSYSTEM=="usb", ATTRS{idVendor}=="0bb4", MODE="0666"
SUBSYSTEM=="usb", ATTRS{idVendor}=="0e79", MODE="0666"
SUBSYSTEM=="usb", ATTRS{idVendor}=="0502", MODE="0666"
SUBSYSTEM=="usb", ATTRS{idVendor}=="0b05", MODE="0666"
SUBSYSTEM=="usb", ATTRS{idVendor}=="413c", MODE="0666"
SUBSYSTEM=="usb", ATTRS{idVendor}=="0489", MODE="0666"
SUBSYSTEM=="usb", ATTRS{idVendor}=="091e", MODE="0666"
SUBSYSTEM=="usb", ATTRS{idVendor}=="18d1", MODE="0666"
SUBSYSTEM=="usb", ATTRS{idVendor}=="0bb4", MODE="0666"
SUBSYSTEM=="usb", ATTRS{idVendor}=="12d1", MODE="0666"
SUBSYSTEM=="usb", ATTRS{idVendor}=="24e3", MODE="0666"
SUBSYSTEM=="usb", ATTRS{idVendor}=="2116", MODE="0666"
SUBSYSTEM=="usb", ATTRS{idVendor}=="0482", MODE="0666"
SUBSYSTEM=="usb", ATTRS{idVendor}=="17ef", MODE="0666"
SUBSYSTEM=="usb", ATTRS{idVendor}=="1004", MODE="0666"
SUBSYSTEM=="usb", ATTRS{idVendor}=="22b8", MODE="0666"
SUBSYSTEM=="usb", ATTRS{idVendor}=="0409", MODE="0666"
SUBSYSTEM=="usb", ATTRS{idVendor}=="2080", MODE="0666"
SUBSYSTEM=="usb", ATTRS{idVendor}=="0955", MODE="0666"
SUBSYSTEM=="usb", ATTRS{idVendor}=="2257", MODE="0666"
SUBSYSTEM=="usb", ATTRS{idVendor}=="10a9", MODE="0666"
SUBSYSTEM=="usb", ATTRS{idVendor}=="1d4d", MODE="0666"
SUBSYSTEM=="usb", ATTRS{idVendor}=="0471", MODE="0666"
SUBSYSTEM=="usb", ATTRS{idVendor}=="04da", MODE="0666"
SUBSYSTEM=="usb", ATTRS{idVendor}=="05c6", MODE="0666"
SUBSYSTEM=="usb", ATTRS{idVendor}=="1f53", MODE="0666"
SUBSYSTEM=="usb", ATTRS{idVendor}=="04e8", MODE="0666"
SUBSYSTEM=="usb", ATTRS{idVendor}=="04dd", MODE="0666"
SUBSYSTEM=="usb", ATTRS{idVendor}=="0fce", MODE="0666"
SUBSYSTEM=="usb", ATTRS{idVendor}=="0930", MODE="0666"
SUBSYSTEM=="usb", ATTRS{idVendor}=="19d2", MODE="0666"
SUBSYSTEM=="usb", ATTRS{idVendor}=="1bbb", MODE="0666"
Now running adb devices should discover your device.
iOS Tips
iOS remote debugging
If you are debugging iOS Apps, you can use the Safari developer tools to remotely debug through a USB cable attached to your iOS phone/tablet. It can be used for emulator too.
This way you have Safari developer tools directly for your App running on the emulator/phone/table. Inspect elements, check console output, and so on and so forth.
First enable the “developer” menu option in the Settings of Safari. Then if you navigate to the “developer” menu option you will see your emulator or connected device listed near the top. From here you can open the developer tools.
Status bar and notch safe-areas
Since mobile phones have a status bar and/or notches, your app’s styling might need some tweaking when building on Capacitor. In order to prevent parts of your app from going behind the status bar, there is a global CSS variable that can be used for creating a “safe-area”. This variable can then be applied in your app’s top and bottom padding or margin.
Quasar has support for these CSS safe-areas by default in QHeader/QFooter and Notify. However it’s important to always check your Capacitor build on several models to see if all cases of your app are dealing with the safe areas correctly.
In cases you need to manually tweak your CSS you can do so with:
// for your app's header
padding-top: constant(safe-area-inset-top) // for iOS 11.0
padding-top: env(safe-area-inset-top) // for iOS 11.2 +
// for your app's footer
padding-bottom: constant(safe-area-inset-bottom)
padding-bottom: env(safe-area-inset-bottom)
Of course you can also use the above example with margin instead of padding depending on your app.